Conversion Insights Dashboard with Revenue Data
Conversion Insights measures the impact of site speed on eCommerce key performance indicators (KPIs).
Yottaa currently offers two versions of the Conversion Insights dashboard. This topic covers the new version currently in beta that assesses the impact of site speed and Yottaa optimizations on revenue metrics like Revenue, Revenue Per Session, and Average Order Value and other metrics detailed in this topic . The new beta dashboard version displays Estimated Revenue Lift or Revenue Lift, Revenue, and Revenue Per Session in the first row of KPIs, as well as other information about how Yottaa is affecting your revenue.
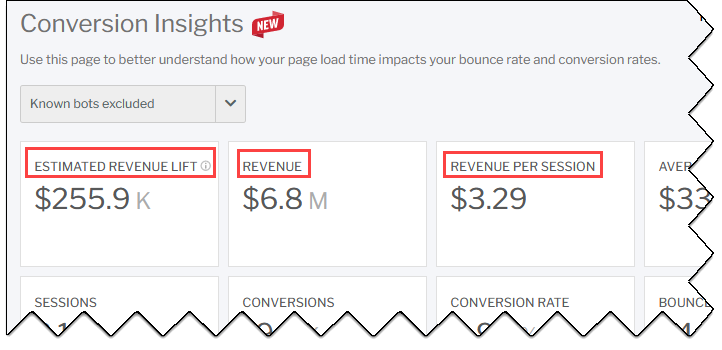
If you see the Revenue KPIs, you have access to the new beta dashboard version. If you do not see the Revenue KPIs, you have the existing version of the Conversion Insights Dashboard.
To qualify for the beta:
-
100% of a site's revenue must be in the US dollar currency. Additional currencies will be supported in the future.
-
Revenue Tracking requirements must be met for accurately capturing revenue data.
Please work with customer support to access the new beta version of the dashboard.
To navigate to the the Conversion Insights dashboard with revenue data, in the main navigation, click Dashboard > Conversion Insights.
To change the date range, click ![]() .
.
To provide you with meaningful site performance information, Yottaa tracks revenue data for sessions on your site.
If Revenue Tracking is enabled on your site but Yottaa is not detecting revenue data, Yottaa displays an alert in the portal. Your site may not be meeting all the requirements for sharing revenue data with Yottaa.
You have a choice about which traffic data Yottaa includes in the calculation of your site's conversion rate and other conversion insights displayed on the Conversion Insights dashboard. The Known bots drop-down menu lets you select which traffic data to include.

Select one of the following options to choose which site traffic data Yottaa will include in your conversion insights.
|
Option |
Definition |
|---|---|
|
Known bots excluded |
Excludes data about traffic from known non-malicious bots like Google, Bing, Facebook, Snapchat, Yandex, and others from calculations of your site's conversion rate and other conversion insights. (Default) |
|
Known bots only |
Calculates your site's conversion rate and other conversion insights based solely on the data about traffic by known bots, excluding the data for all shopper traffic. Useful to get an idea of how much of the traffic on your site is non-malicious bot traffic. |
|
All traffic |
Calculates your site's conversion rate and other conversion insights using data for all the traffic on your site. |
The following table describes the Key Performance Indicators (KPIs) at the top of the Conversion Insights Dashboard with Revenue Data.
|
Example |
Metric |
Definition |
|---|---|---|
|
|
Estimated Revenue Lift/Revenue Lift |
Estimated Revenue Lift—Calculates the incremental revenue gain attributed to Yottaa's optimizations by calculating the difference between Optimized and Unoptimized Revenue Per Session and extrapolating across all Sessions within a given time frame Revenue Lift—Calculates the incremental revenue gain attributed to Yottaa’s optimizations by directly comparing Revenue from Optimized traffic to Unoptimized traffic. Estimated Revenue Lift displays when the site’s traffic is split unevenly between optimized and unoptimized sessions. Revenue Lift displays if traffic is split 50/50 between optimized and unoptimized sessions. |
|
|
Revenue |
The total revenue generated from every session that results in an order. |
|
|
Revenue Per Session |
The average revenue per session calculated by dividing total revenue by number of sessions. This indicates the monetary value each session contributes to the overall business. |
|
|
Average Order Value |
The average revenue per order calculated by dividing total revenue by total number of orders. This helps to evaluate spending habits of shoppers and impact of sales strategies on buyers. |
|
|
Optimized Page Load Time |
The average onload Onload time measures the time it takes for the initial HTML document to fully load, including all stylesheets, images, and subframes necessary for user interaction. Fast page load times are critical for user retention and can significantly impact conversion rates and revenue per session. |
|
|
Sessions |
Total number of sessions for the selected date range . A session is the period of time in which a shopper is active on your site. A session ends or times out after 30 minutes of shopper inactivity. A session may comprise one or several page views. |
|
|
Conversions |
Represents total conversions. A conversion is defined to occur when a site visitors’ session reaches the order confirmation page, indicating a transaction has taken place. This indicates the site’s effectiveness for turning a visitor into a paying consumer. Each session can have only one conversion. |
|
|
Conversion Rate |
The percentage of your shoppers' sessions |
|
|
Bounce Rate |
The percentage of sessions |
|
|
Session Depth |
The average number of page views in a session. Deeper sessions often indicate higher shopper interest and purchase intent. |


The Optimization Impact section quantifies the effectiveness of Yottaa’s site speed enhancements by comparing the performance of optimized traffic against unoptimized, or hold-out, traffic. This comparison highlights the tangible impact of optimization across several metrics such as Revenue per Session, Average Order Value, and Conversion Rate. For instance, a significant reduction in Page Load Time can noticeably improve the user experience, resulting in an uplift in Revenue per Session.
For each metric displayed in the KPIs at the top of the dashboard, the Optimization Impact table displays the total value for the optimized and the unoptimized traffic, as well as the net impact and the percentage impact that Yottaa optimization provides as measured by that metric.
Click on any metric in the table on the right to display its Optimization Impact and Optimization Impact %, both numerically and visually with the optimized and unoptimized values in a graph.

The following table describes the KPIs and graph on the left side of the Optimization Impact section shown above.
|
Optimization Metric |
Description |
|---|---|
| Optimization Impact | Measures the difference in the value of the selected metric for optimized compared unoptimized traffic. |
| Optimization Impact % | Measures the percentage difference in how the selected metric performs, between optimized and unoptimized traffic. |
|
Graph |
Shows the values of the selected metric for the optimized and the unoptimized traffic, in a bar graph. |
The following table describes the grid of metrics on the right side of the Optimization Impact section.
|
Metric |
Description |
||||||||
|---|---|---|---|---|---|---|---|---|---|
|
|
The rows in this table display metrics for the optimized and unoptimized traffic, as well as the total difference and the percentage difference in that metric, for optimized traffic compared to unoptimized traffic. We display a value for each metric in each of these four categories:
|
||||||||
| Estimated Revenue |
Average revenue per session times number of sessions. |
||||||||
|
Revenue per Session |
Average revenue per session. | ||||||||
|
Average Order Value |
The average revenue per order calculated by dividing total revenue by total number of orders. |
||||||||
|
Conversion Rate |
The percentage of your shoppers' sessions |
||||||||
|
Bounce Rate |
The percentage of sessions |
||||||||
|
Session Depth |
The average number of page views in a session . |
||||||||
|
Sessions |
Total number of sessions for the selected date range . |
||||||||
|
Revenue |
Total revenue generated from all sessions that have resulted in a conversion. |
||||||||
|
Conversions |
Total conversions for all sessions. A session can only have one conversion. |
||||||||
| Orders | The total count of purchase transactions completed, based on unique Order IDs. A session can have one or multiple orders. | ||||||||
| Page Load Time | The average page load time for sessions. |
Conversion Zone Analysis identifies the range where the highest conversion rates occur and shows the impact of keeping your traffic within that range. Note that if optimizations are not yet applied, the dashboard displays a simplified version of the Conversion Zone without the optimized versus unoptimized comparison. You still see a Conversion Zone as well as the comparison that shows why it’s important to be in the range.
Using an eCommerce site’s onload metrics, Conversion Zone identifies the load time range where at least 60% of conversions take place and the cumulative conversion rate is highest. The cumulative conversion rate is calculated by taking all the conversions in a time range and dividing it by all the sessions in the same time range.
Example: Sessions in the 0-4 second range:
50 conversions / 1000 sessions = 5% cumulative conversion rate
In the Conversion Zone section, you can:
-
See at top left how many sessions fall within the Conversion Zone when traffic is optimized versus unoptimized.
-
Dynamically visualize the correlation between site speed and key eCommerce metrics such as Revenue per Session, Conversion Rate, and Average Order Value over various load times.
-
Select the metrics you want to observe, to manipulate the graph to your preference.
|
Example |
Metric |
Description |
||||||||
|---|---|---|---|---|---|---|---|---|---|---|
|
|
Optimized Sessions in Conversion Zone |
The percent of all sessions that fall within the Conversion Zone A session
|
||||||||
|
|
Unoptimized Sessions in Conversion Zone |
The percent of all sessions that fall within the Conversion Zone for traffic that is unoptimized. |
||||||||
|
|
Yottaa's Impact |
The percent difference between optimized and unoptimized sessions in the Conversion Zone. |
||||||||
|
|
Conversion Zone Comparison |
Compares the following metrics in and out of the Conversion Zone:
|


Select metrics in the two drop-downs to compare them in the graph. The left drop-down determines the scale for the left y-axis, the right drop-down for the right y-axis. Each metric displays a bar or line graph plotted against the series of average page load times that are displayed on the x-axis. Most of the metrics are available in both drop-downs.
The example below plots both revenue per session and a comparison of optimized versus unoptimized sessions against an x-axis of increasing average page load times.

|
Metric |
Description |
|---|---|
| Revenue Per Session |
The average revenue per session calculated by dividing total revenue by number of sessions. (Left drop-down only.) |
| Average Order Value | The average revenue per order calculated by dividing total revenue by total number of orders. |
| Conversion Rate |
A line graph showing the conversion rate for each average page load time. |
| Bounce Rate | A line graph showing the bounce rate for each average page load time. |
| Session Depth | The average number of page views in a session |
| Revenue | The total revenue generated from every session that results in an order. |
| Orders | The total number of orders for all sessions. |
| Conversions | A bar graph where each bar represents the total conversions that fell within a range of average page load times. |
| Sessions | A bar graph where each bar represents the total sessions that fell within a range of average page load times. |
| Optimization Comparison of Sessions | Displays a bar graph showing the percent of sessions that were optimized and unoptimized for each range of average page load times. (Right drop-down only.) |
|
Example |
Metric |
Definition |
|---|---|---|
|
|
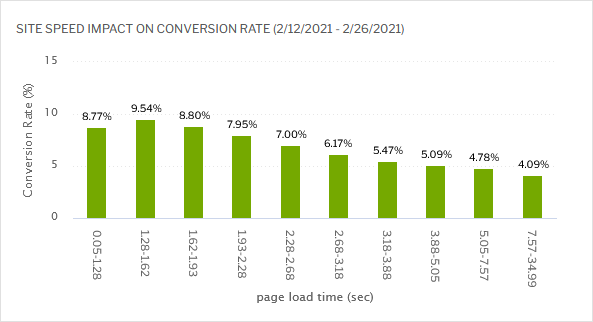
Site Speed Impact on Conversion Rate |
In this graph, each bar represents the conversion rate for sessions that fall within a range of average page load times for the past 7 days. Each bar represents an equal number of sessions. Move the mouse over each bar to see further details. |
|
|
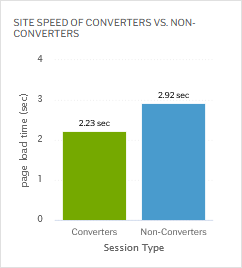
Site Speed of Converters |
Shows the average page load time for sessions that included a conversion and sessions that did not. |
|
|
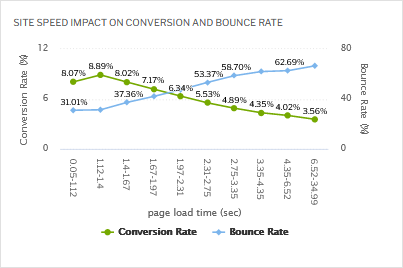
Site Speed Impact On Conversion and Bounce Rates |
Each point on the graph represents sessions within a range of average page load times. Move the mouse over each point to see the conversion and bounce rates for that range. Each time range represents an equal number of sessions. Other page load time ranges are also available for selection. |
|
Example |
Metric |
Definition |
|---|---|---|
|
|
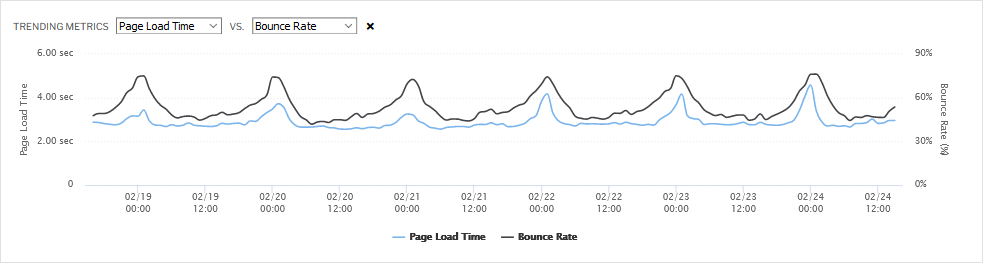
Trending Metrics |
Shows how your site's metrics are changing over time. You can compare optimized vs. unoptimized page load time, conversion rate, bounce rate, the number of conversions, and the number of sessions. Use the drop-down menus to select metrics and the Estimated Revenue Lift and Optimization Impact % on Revenue per Session are cumulative for the selected date range. In other words, each data point for these metrics in the trend chart is inclusive of previous data from the beginning of the time range. |