Edge Acceleration Dashboards
As a Edge Acceleration customer, you have access to both our Edge Acceleration and Yottaa products.
-
To access Edge Acceleration, navigate to apps.yottaa.com.
-
To access Yottaa, navigate to rapid.yottaa.com.
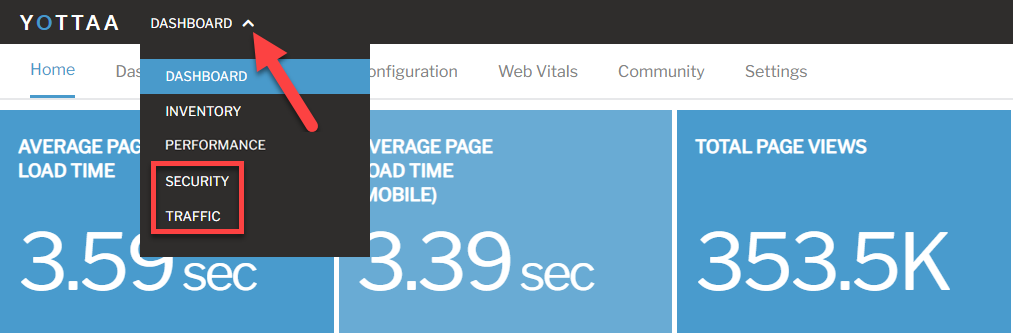
You can navigate between Edge Acceleration and Yottaa using the portal menu at the top of the screen. The two Edge Acceleration dashboards are the Security Analytics Dashboard and the Traffic Analytics Dashboard.
Use the Edge Acceleration user interface for traffic and security analysis. These dashboards show information that Yottaa gathers from the servers, so they update in real time. You can likely see information about your site as soon as Edge Acceleration is installed.
Use the Yottaa user interface for performance data. The Yottaa dashboards show information that Yottaa gathers from your users' browsers. Allow about 24 hours after installation for data to appear on the Yottaa dashboards.
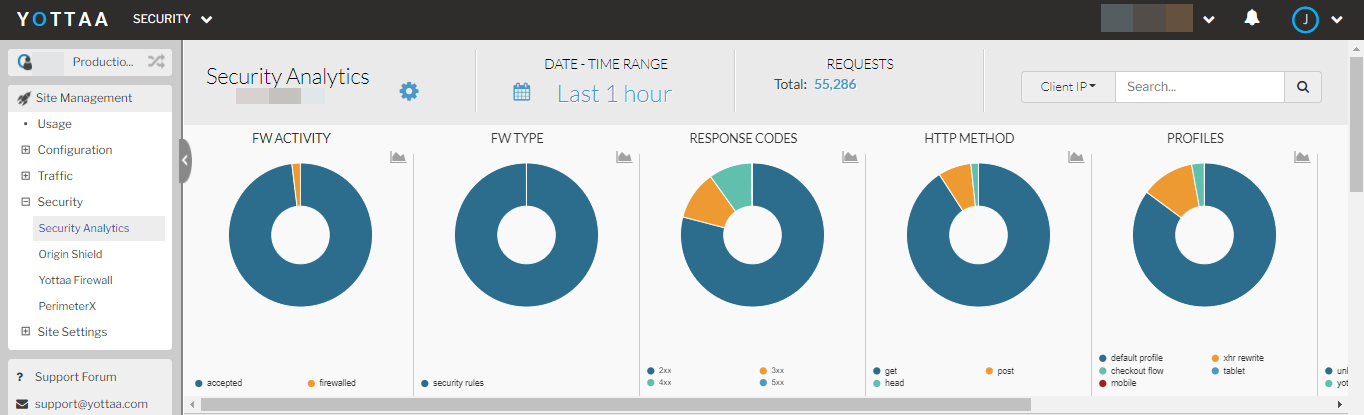
Security Analytics Dashboard
From the Security Analytics Dashboard, you can review security activity on your site. You can see information such as which requests are hitting your firewall, which firewall rules are being used, and which response codes customers are receiving. Click a segment of any pie chart to filter the dashboard by that specific data. For example, you can click firewalled in the FW Activity pie chart to see only firewalled requests. You can further filter the dashboard by clicking 4xx in the Response Codes pie chart. Filters appear at the top of the dashboard. Hover over a filter to delete or invert it.
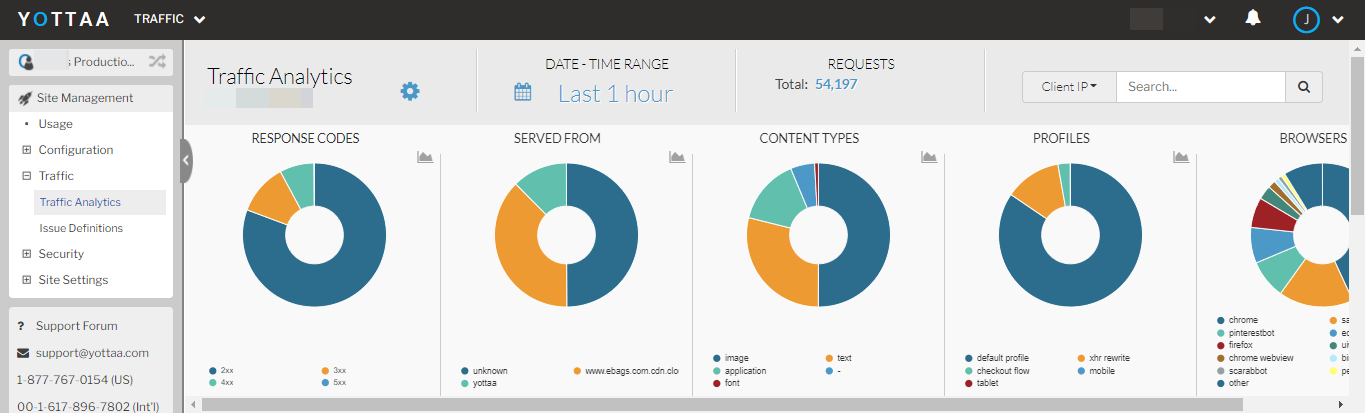
Traffic Analytics Dashboard
Use the Traffic Analytics dashboard to review traffic patterns on different pages of your site and identify any issues or unusual behavior. You can view data such as which browsers customers are using to access your site, which countries or geographical regions access your site most, and which types of content your customers are viewing on your site. You can filter this information by different time periods, user agents, errors received, and more.