Performance by Page Dashboard
The Performance by Page dashboard shows performance metrics by page category. You can select which page category you want to view performance details for in the drop-down menu in the title of the dashboard.
This dashboard can give you a clearer picture of where performance problems are occurring. Page category information is also available on other dashboards, including the Violations and JavaScript Errors Dashboard, Performance Dashboard, Yottaa's Impact Dashboard, and Traffic Dashboard.
You can set up page categories in Settings > Page Categories. See Page Categories for more information.
Performance
You can select the metric for the Performance section in the drop-down menu at the top of the page. The drop-down changes the metric for the first data box and all the graphs in the Performance section. The following metrics are available:
| Domain Lookup |
The amount of time it takes the server to look up the site's domain based on the HTTP request. |
| Connect Time |
The time it takes to establish a connection to the server. |
| First Byte | The time from the start of a network request until the first byte of information reaches the shopper's browser. |
| Last Byte | The time from the start of a network request until the last byte of information reaches the shopper's browser. |
| First Paint |
The first moment that content is rendered on the screen, even if it is just a pixel. |
| DOM Complete |
The amount of time it takes for the HTML document to be fully downloaded along with all stylesheets, images, and other resources. DOM Complete should occur right before the onload event. You can compare these two metrics to check if the onload event is taking longer than desired. |
| DOM Interactive | The amount of time it takes for the HTML document to be fully parsed, and the DOM to be built and able to interact with CSS, JavaScript, and other resources. |
| DOM Content Loaded |
The amount of time it takes for the initial HTML document to be loaded and parsed, without waiting for stylesheets, JavaScript, and other resources. |
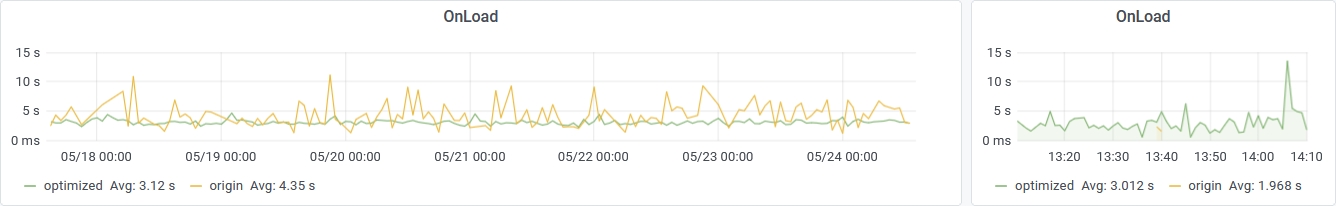
| Onload |
The amount of time it takes for the initial HTML document to be loaded with all stylesheets, images, and subframes, and all event handlers for window.onload to be called. At this point, the page is interactive to users. Throughout the Yottaa portal, "onload time |
|
Example |
Metric |
Description |
|---|---|---|
|
|
Average Onload |
Shows the average selected metric for the selected page category. For this data box, and all the graphs in this section, select the desired metric in the drop-down menu at the top of the page.
|
|
|
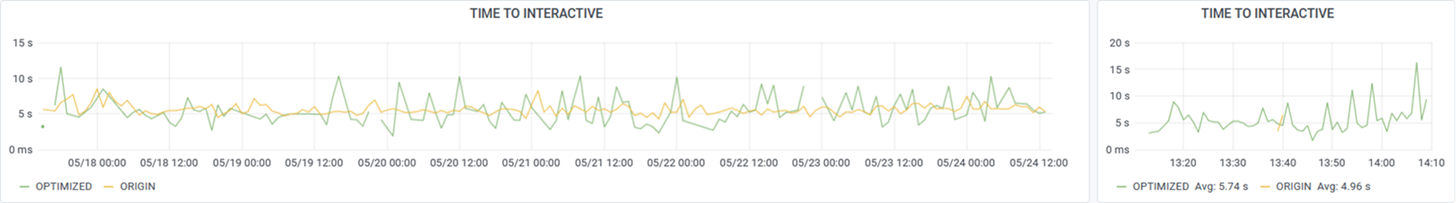
Time to Interactive |
Measures the time when the page becomes reliably interactive to users by searching for a five-second pause in network activity after the last long task following the first contentful paint. TTI is the moment when that long task ends. If there is no long task after first contentful paint, TTI is the moment that first contentful paint is complete. |
|
|
Resource Count |
The number of resources that have loaded on pages in the selected page category. |
|
|
Inventory |
Shows the third parties that have loaded on pages in the selected page category during the selected period. |
|
|
Onload graphs |
|
|
|
Device Type graphs |
|


Web Vitals
| Example | Metric | Description |
|---|---|---|
|
Time to Interactive graphs | These two graphs show your site's average TTI over time for both optimized and unoptimized (origin) traffic. The first graph shows the last 7 days or the selected period. The second graph shows the last hour. You can use the second graph to see the effects of any recent changes to your site. |
|
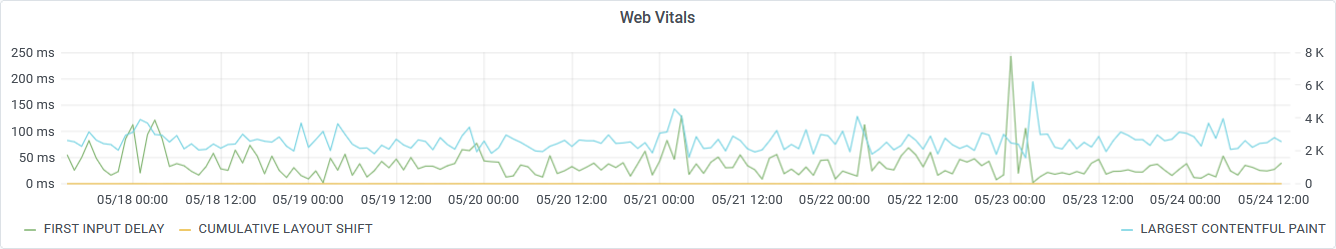
Web Vitals | Shows your site's average First Input Delay |
|
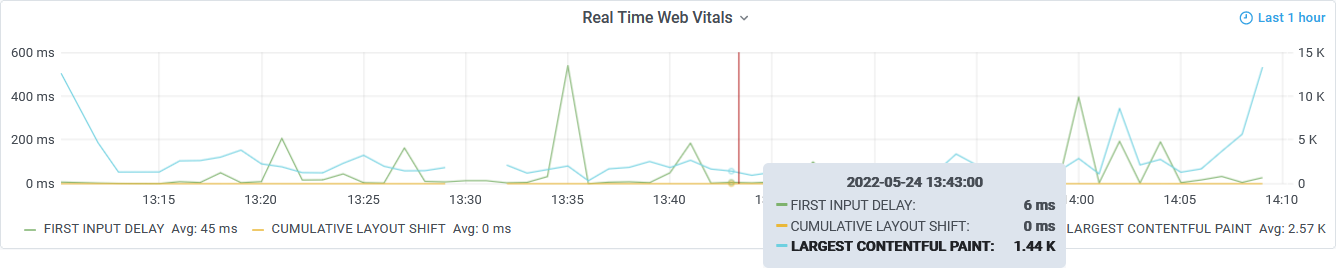
Real-time Web Vitals | Shows your site's average First Input Delay, Cumulative Layout Shift, and Largest Contentful Paint over the last hour for all traffic. You can use this graph to see the impact of any recent changes you have made to your site. |

|
First Input Delay | The time it takes for the page to respond to the first user interaction (for example, a click, tap, or a scroll). |

|
Cumulative Layout Shift | The amount by which the content of a page shifts or reflows, which is visually disruptive and can cause users to accidentally click on the wrong element. |
|
|
Largest Contentful Paint |
The time it takes for the largest piece of visible content on a page to load. |

Violations

|
Total Violations | Shows average number of violations per page view for the selected page category. For more information about violations, see the Violations and JavaScript Errors Dashboard. |

|
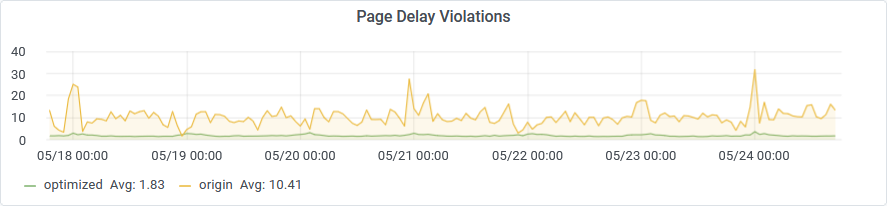
Page Delay Violations | Shows the average number of page delay violations |

|
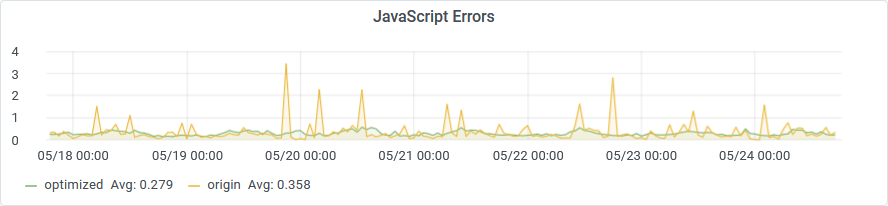
JavaScript Errors | Shows the average number of JavaScript errors |
|
|
JavaScript Error Rank | Shows your JavaScript error rate's percentile ranking compared to other Yottaa sites. A higher percentile score means that your average number of JavaScript errors per page is higher than most other Yottaa sites. For example, if your score is 85 percent, your site has a higher JavaScript error rate than 85 percent of Yottaa sites. |
|
Page Delay Violations graph | Shows your page delay violation rate (average number of violations per page view) for optimized and unoptimized (origin) traffic over the course of the selected period. |
|
|
JavaScript Errors graph |
Shows your JavaScript error rate (average number of errors per page view) for optimized and unoptimized (origin) traffic over the course of the selected period. |
|
|
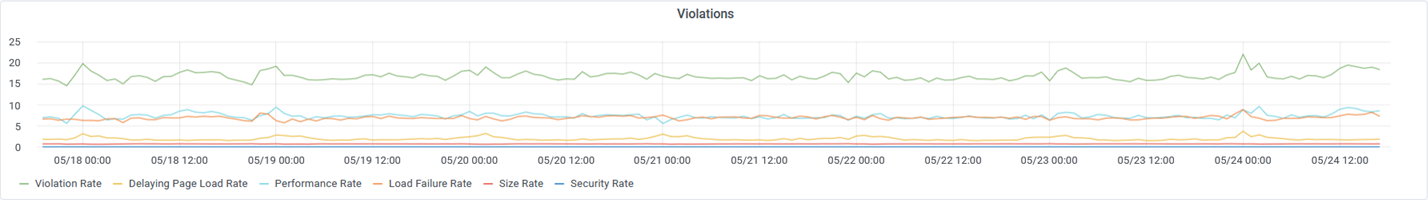
Violations Graph |
Shows your violation rate (average number of violations per page view) for all types of violations. Click a violation type in the graph legend to show only that type of violation. |
Root Cause of Page Delay Violations
Each of the tables in this section details the most recent violations on pages in the selected page category. For each violation, the table displays the URL of the resource causing the violation. The Count column shows how many violations this resource has caused during the selected period. You can use this section to get diagnostic information about why one page category might be performing slower than others.